The Dead Good Club · Special Water Report
ThirstyWorld
Where the world’s water and electricity go, from farms to the machines.
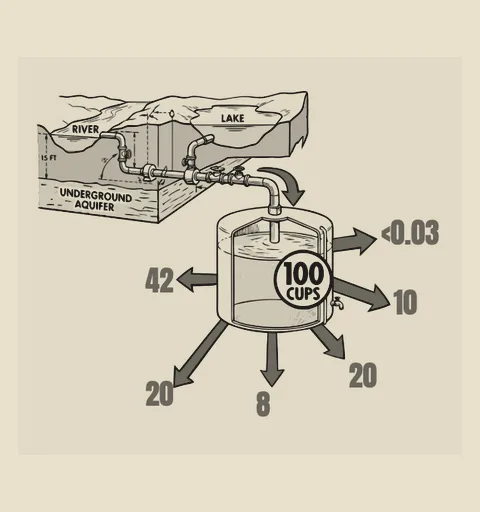
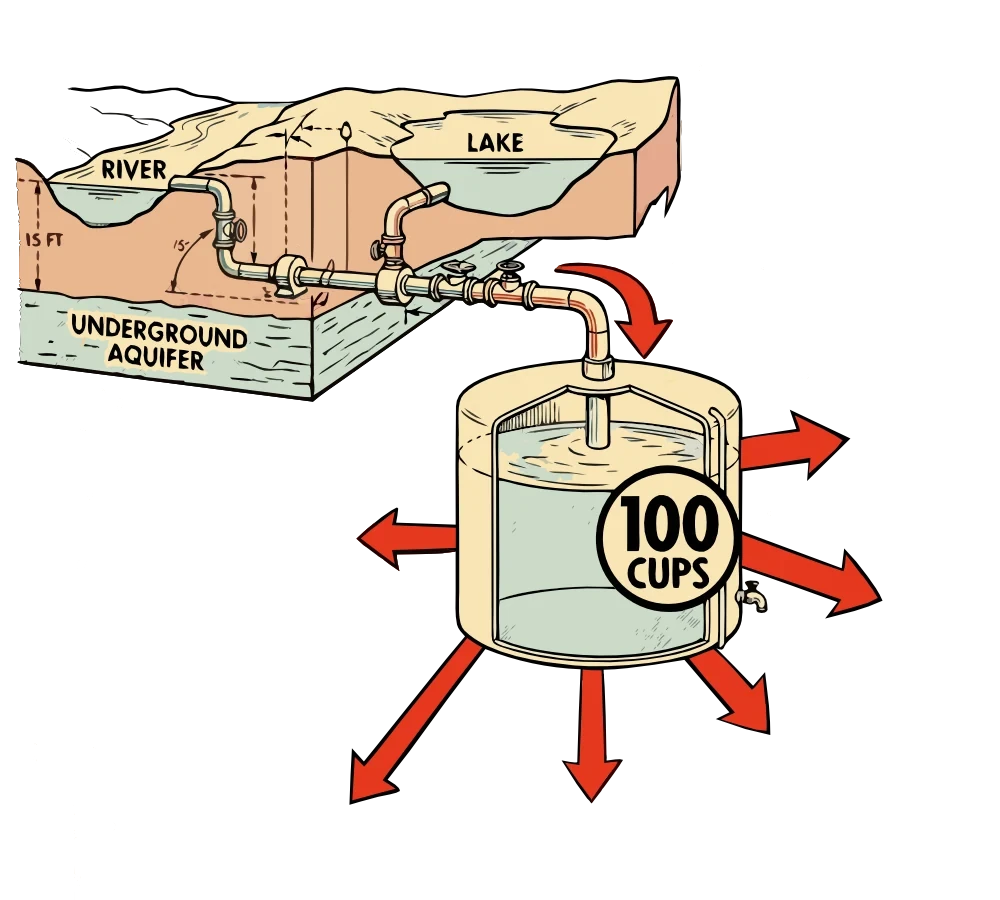
Every 100 cups withdrawn worldwide
Where does our freshwater go?
Farming takes about 70 of every 100 cups humanity pulls from rivers, lakes and aquifers. Globally, that’s 7.67 trillion litres a day.
Other agriculture
Cattle & dairy
Corn / maize
Factories & industry
Homes & services
Data centres
Farming · 70 cups
Other agriculture · 42 cups
All other global crops (rice, wheat, soy, cotton), aquaculture, and non-cattle livestock such as pigs, poultry and sheep.[Böll]
Cattle & dairy · 20 cups
Animal agriculture accounts for nearly 29% of all agricultural water; beef and dairy cattle alone are about 20 of the 100 cups. Crucially, 98% is not drunk by the cow: it is “virtual water” used to grow their pasture, hay and grain feed.[OAG]
Corn / maize · 8 cups
One of the world’s most heavily irrigated crops, corn alone takes about 8 of the 100 cups. It overlaps with cattle, since roughly 40% of all global corn is grown to feed livestock rather than eaten by people.[WRI]
Everything else · 30 cups
Factories & industry · 20 cups
Manufacturing, fossil-fuel processing and heavy industry.[FAO]
Homes & services · 10 cups
Municipal drinking water, sanitation, commercial buildings and public services.[FAO]
Data centres · <0.03 cup
Counted within the industrial sector: roughly 0.5 to 1 billion cubic metres globally per year, although large increases are expected.[FoodFacts]
The machines · gigawatts, 2026 → 2030
Power demand: AI vs non-AI data centres
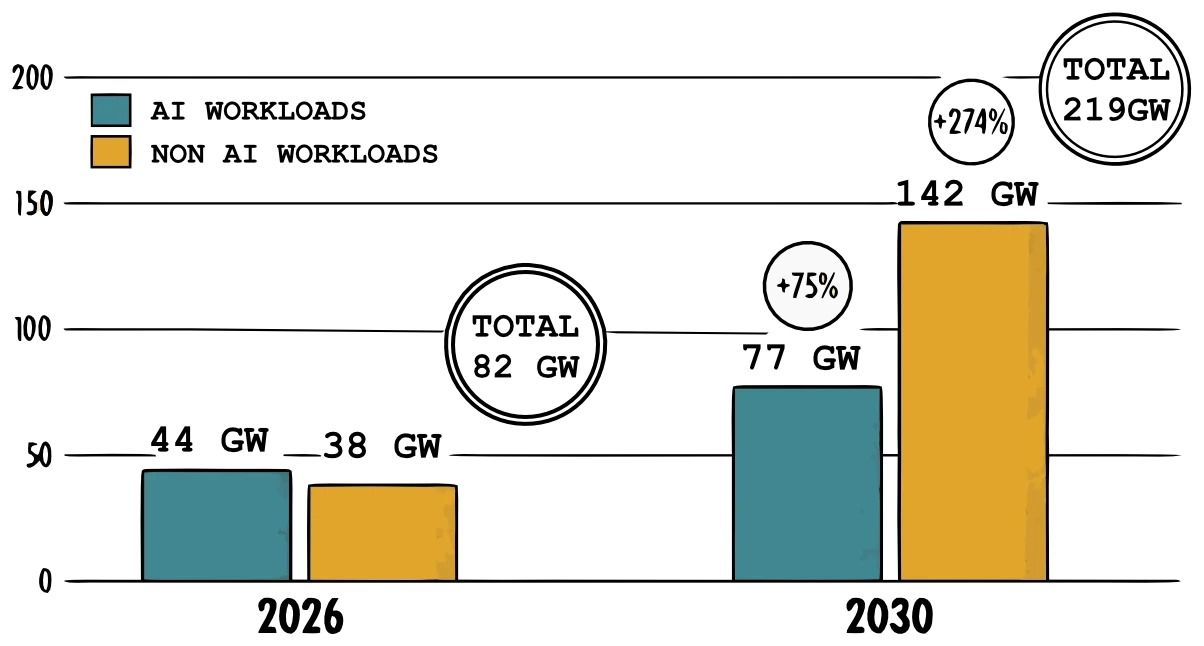
By 2030 total data-centre demand nearly triples, from 82 to 219 GW. Non-AI workloads still grow fastest in raw terms, though AI is the headline driver.[programs.com]
Combined energy + water · average US / UK household
Your impact cup: typical usage for one person
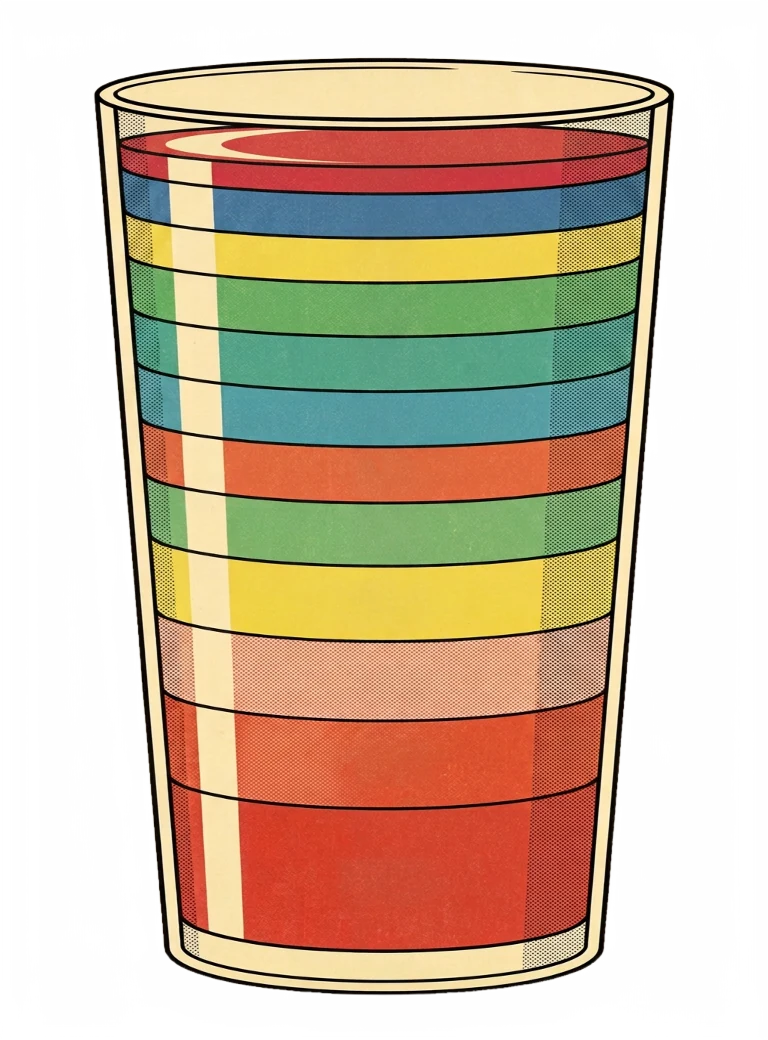
- 1%Drinking & cooking waterTap water for drinking & food prep
- 2%AI prompts & toolsData-centre + device energy for AI
- 3%Streaming & social feedsTVs, streaming devices, phones
- 5%Outdoor wateringGarden & yard water use
- 5%LightingAll home lighting
- 5%Fridge/freezer & food storageAlways-on refrigeration energy
- 6%Cooking & dishwashingOven, hob, dishwasher, kitchen taps
- 7%General digital lifeComputers, monitors, routers, screen work
- 10%LaundryWasher + dryer energy + water
- 11%Toilet flushing & bathroom faucetsToilets + bathroom sink water
- 15%Hot water for washingWater-heating + shower / tap water
- 30%Heating & cooling your homeSpace heating, AC, fans
Heating, hot water and the bathroom dominate; the whole of digital life (screens, streaming and AI together) is about 12%.
*Combined energy + water impact index for an average US / UK household, normalized to 100%.
Sources: EIA · use of energy in homes · EIA RECS 2020 · UK ECUK 2023 · UK NEED · Nesta · EPA WaterSense.
A note on the figures: best-available public estimates (FAO, IEA, EPA, EIA, USGS, programs.com and others, tagged throughout). Methodologies, especially for digital energy and water, differ, so treat ranges as ranges. Compiled by The Dead Good Club darkroom.